WRITING TASK 1
You should spend about 20 minutes on this task.
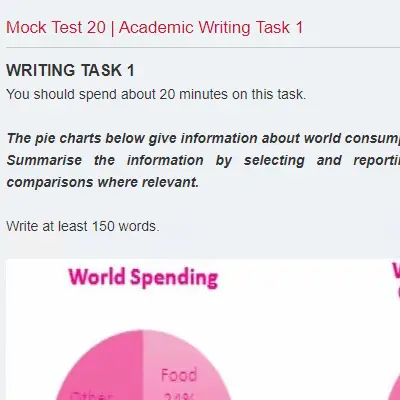
The pie charts below show the average household expenditures in a country in 1950 and 2010.
Summarize the information by selecting and reporting the main features, and make comparisons where relevant.
Write at least 150 words.
.png)
IELTS WRITING TASK 1 (ACADEMIC MODULE)
Overall, people in the country spent the most money on housing and food in both 2 years, and there were some changes in the average household consumption of all sectors in 1950 and 2010.
In particular, in 1950, the biggest amount of money was spent on housing, at 72.1% of the pie chart. [Crack IELTS with Rob] This was followed by food, at 11.2%. The third position belonged to education, which accounted for 6.6% of the total. Transportation and other shared relatively the same percentage, at around 3.8%. The health care field was spent the least money, at 2.4% of all fields.
As for 2000, there was a significant decrease to 22% in the amount of money spent on housing. The figure for food became the biggest proportion among all sectors after increasing dramatically to 34%. [Crack IELTS with Rob] Likewise, Transportation and others witnessed a sharp growth to 19.2% and 14% respectively. The rate of Health care in 2000, at 4.5 nearly doubled in 1950. Education was mostly unchanged, at around 6.3% in 2000.
q41-hide
Please click the red words below for other Sections in this Mock Test:
| Mock Test 23 | Speaking Part 2 |
| Mock Test 23 | Speaking Part 1 |
| Mock Test 23 | Writing Task 2 |
.png)