WRITING TASK 1
You should spend about 20 minutes on this task.
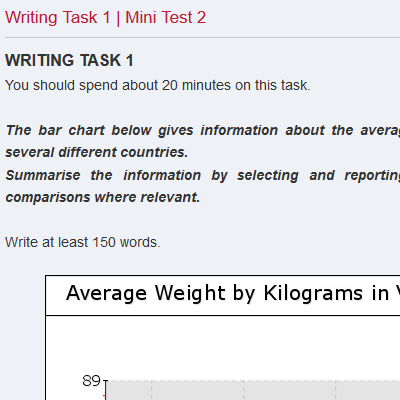
The bar chart below shows the percentage of unemployed graduates, aged 20-24, in one European country over a two-year period.
Summarise the information by selecting and reporting the main features, and make comparisons where relevant.
Write at least 150 words.

Academic Writing Task 1
The bar chart illustrates the unemployment rates of male and female graduates who are in the age from 20 to 24 in Europe between two years 2008 and 2009. Overall, the percentage of unemployment increased gradually over the period and the rate in male graduates was higher than the rate in female graduates.
In 2008, there were 10% of male graduates who were unemployed in January 2008 and were twice as many rates as the female, at 5%. From January to April, the unemployment rates of male and female decreased gradually to 5% and 2.5 % respectively. However, on October, This rate increased significantly and the rate in male was still higher than the percentage in female, at 16% and 11%, respectively.
In 2009, from January to April, The rate of unemployed graduates male was unchanged, at 12% while the percentage in female fell slightly from 8% to 3%. Between July and October, the rate in male decreased slightly and then increased sharply to 23% and this rate was higher than the rate of female, at 18% in the period of time.
Please click the red words below for other Sections in this Mock Test:
| Mock Test 3 | Speaking Part 1 |
| Mock Test 3 | Speaking Part 2 |
| Mock Test 3 | Academic Writing Task 2 |


.png)
.png)