
WRITING TASK 1
1. Bar chart
You should spend about 20 minutes on this task.
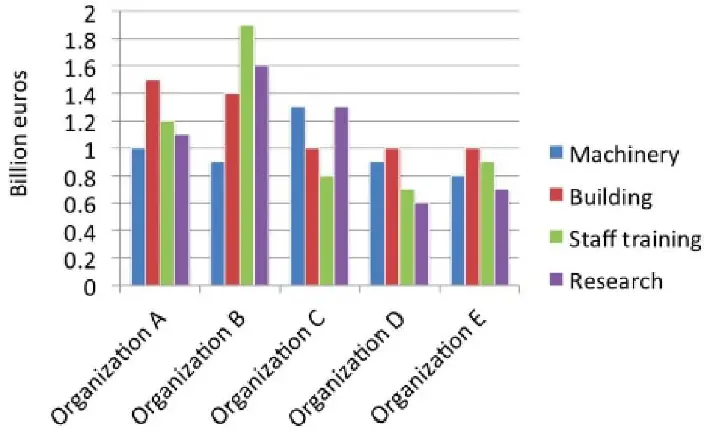
The bar chart below shows the amount of money invested in each category from 5 organizations.
Summarise the information by selecting and reporting the main features, and make comparisons where relevant.
Write at least 150 words.
2. Table
You should spend about 20 minutes on this task.
The table below shows the percentage of household and electronic goods in New Zealand in 2002 and 2020.
Summarise the information by selecting and reporting the main features, and make comparisons where relevant.
Write at least 150 words.
Electronic goods in New Zealand households
| Percentage of households with | 2002 | 2020 |
| Washing machine | 97 | 98 |
| Color TV | 95 | 99 |
| Computer | 50 | 78 |
| Cell phone | 20 | 80 |
| Video recorder | 75 | 60 |
| Dishwasher | 45 | 55 |
| Digital camera | 2 | 40 |