WRITING TASK 1
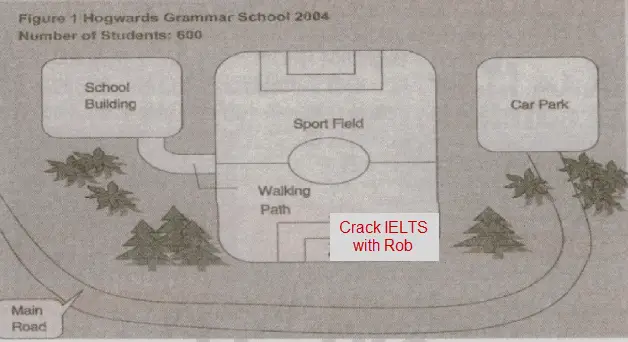
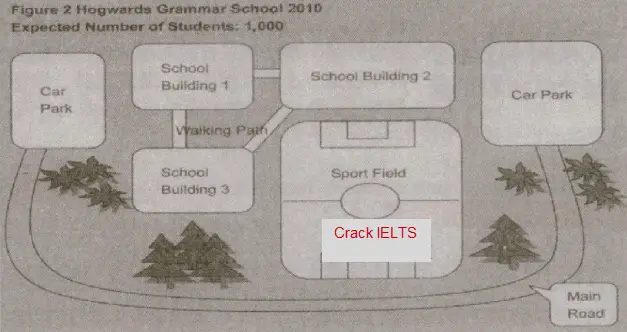
1. Map
You should spend about 20 minutes on this task.
The maps below give information about a school in 2004 and the change of the same school in 2010.
Summarise the information by selecting and reporting the main features, and make comparisons where relevant.
Write at least 150 words.
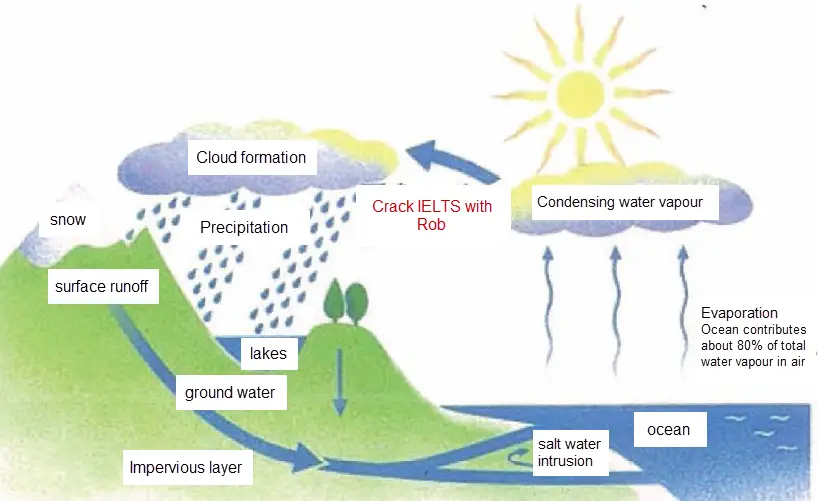
2. Process
You should spend about 20 minutes on this task.
The diagram below shows the water cycle, which is the continuous movement of water on, above and below the surface of the Earth.
Summarise the information by selecting and reporting the main features, and make comparisons where relevant.
Write at least 150 words.
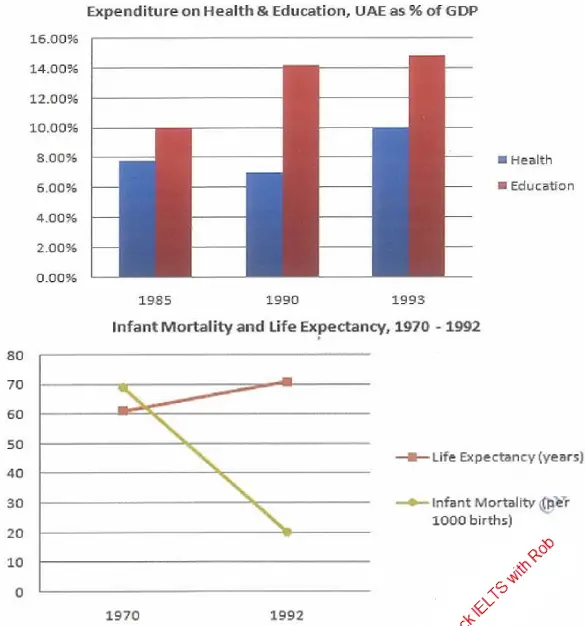
3. Mix Chart
You should spend about 20 minutes on this task.
The bar chart shows the expenditure on health and education in UAE, while the line chart illustrates the changes in life expectancy and infant mortality.
Summarise the information by selecting and reporting the main features, and make comparisons where relevant.
Write at least 150 words.