WRITING TASK 1
1. Process
You should spend about 20 minutes on this task.
The diagrams below show the present college and its plan in 2025 for proposed.
Summarise the information by selecting and reporting the main features, and make comparisons where relevant.
Write at least 150 words.
.png)
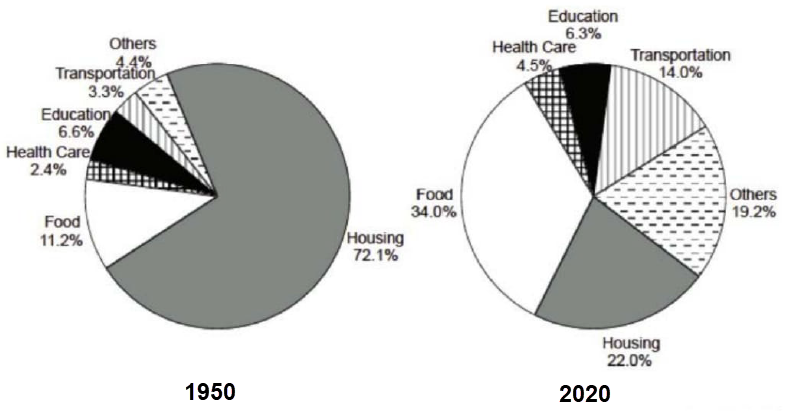
2. Pie chart
You should spend about 20 minutes on this task.
The pie charts show the household expenditures on average in a country in 1950 and 2020.
Summarise the information by selecting and reporting the main features, and make comparisons where relevant.
Write at least 150 words.
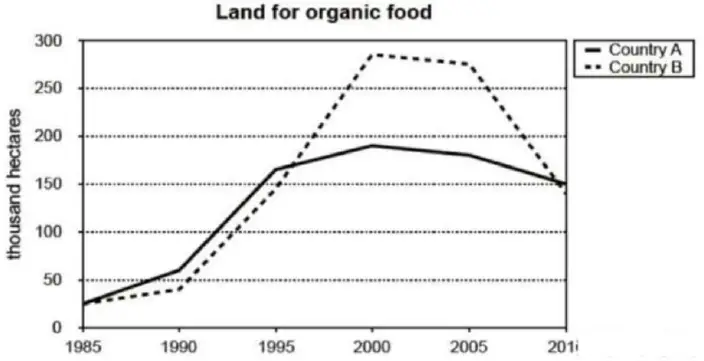
3. Line graph
You should spend about 20 minutes on this task.
The graph shows the information of land use for organic food in two countries, A and B, from 1985 to 2010.
Summarise the information by selecting and reporting the main features, and make comparisons where relevant.
Write at least 150 words.