
WRITING TASK 1
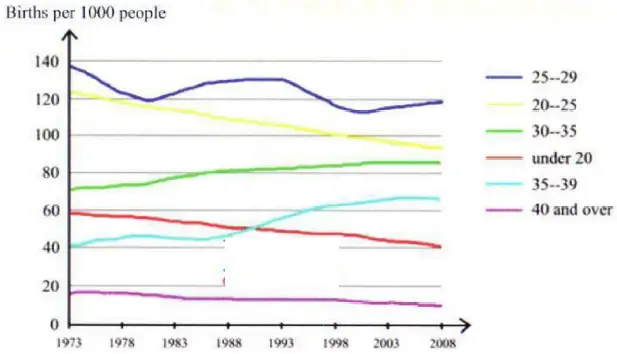
1. Line graph
You should spend about 20 minutes on this task.
The graph shows the information about the UK birth rates for women from 1973 to 2008.
Summarise the information by selecting and reporting the main features, and make comparisons where relevant.
Write at least 150 words.
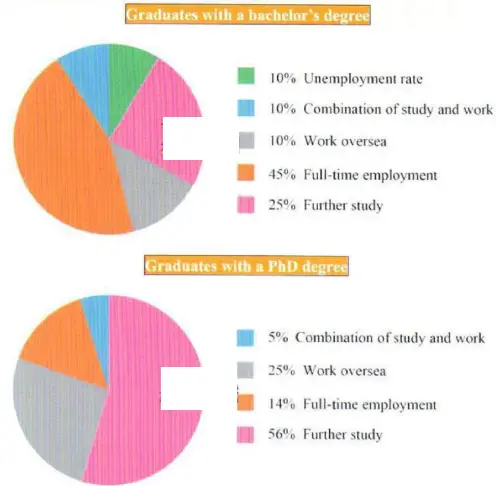
2. Pie chart
You should spend about 20 minutes on this task.
The pie charts below present information about what the UK graduates did after leaving university in 2008.
Summarise the information by selecting and reporting the main features, and make comparisons where relevant.
Write at least 150 words.
3. Pie chart + Bar char
You should spend about 20 minutes on this task.
The pie chart below shows information about world water resources, and the bar chart shows the utilisation of water in Egypt, Saudi Arabia and Canada.
Summarise the information by selecting and reporting the main features, and make comparisons where relevant.
Write at least 150 words.
.png)