WRITING TASK 1
You should spend about 20 minutes on this task.
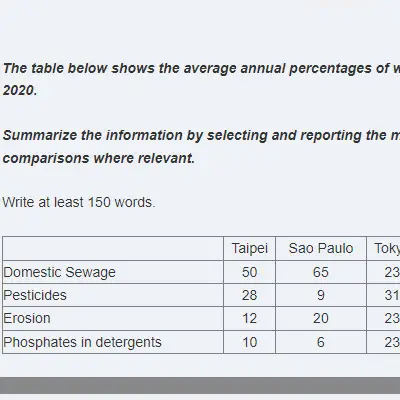
The chart and graph below give information about sales and share prices for Coca-Cola.
Summarise the information by selecting and reporting the main features, and make comparisons where relevant.
Write at least 150 words.

IELTS WRITING TASK 1 (ACADEMIC MODULE)
The pie chart shows the worldwide distribution of sales of Coca-Cola in the year 2000 and the graph shows the change in share prices between 1996 and 2001.
In 2000, Coca-Cola sold a total of 17.1 billion cases of their fizzy drink product worldwide. The largest consumer was North America, where 30.4 percent of the total volume was purchased. The second largest consumer was Latin America. Europe and Asia purchased 20.5 and 16.4 percent of the total volume respectively, while Africa and the Middle East remained fairly small consumers at 7 percent of the total volume of sales.
Since 1996, share prices for Coca-Cola have fluctuated considerably. In that year, shares were valued at approximately $35. Between 1996 and 1997, however, prices rose significantly to $70 per share. They dipped a little in mid-1997 and then peaked at $80 per share in mid-98. From then until 2000 their value fell consistently but there was a slight rise in mid-2000.
Please click the red words below for other Sections in this Mock Test:
| Mock Test 7 | Speaking Part 3 |
| Mock Test 7 | Speaking Part 2 |
| Mock Test 7 | Writing Task 2 |