WRITING TASK 1
You should spend about 20 minutes on this task.
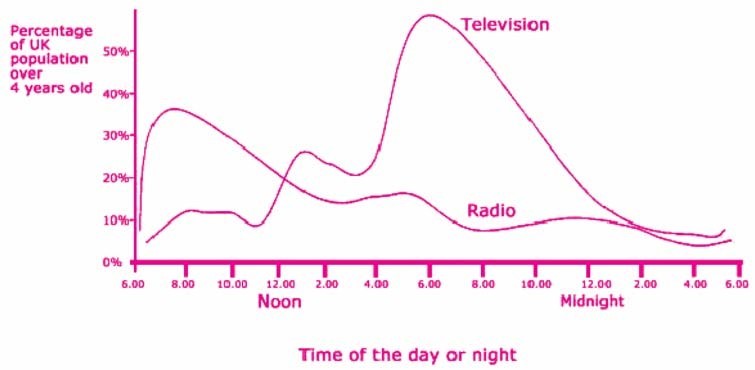
The line graph demonstrates the percentage of UK population who are aged over 4 years old following the radio and television during the October to December period in 2020.
Summarise the information by selecting and reporting the main features, and make comparisons where relevant.
Write at least 150 words.

IELTS WRITING TASK 1 (ACADEMIC MODULE)
The graph shows (relates) the percentage of radio and television audiences over 4 years old in the UK throughout the day from October to December 2020.
The figure reveals that before 12 o’clock there were more radio audiences, while more people turned to television after that time.
From the graph, it is clearly seen that in the early morning, at 6 a.m., few people watch TV. [Crack IELTS with Rob] However, from this time onwards, the number of TV audience is on the rise. At noon, the people watching TV account for about 12% of the total population. In the period between 12:00 and 2:00 p.m., the TV audience experiences a sharp increase from 12% to approximately 25%.
From 2:00 p.m. to 4:00 p.m., the figure remains constant at about 20%, then reaches the peak of the day, approximately 55% at 7 p.m.. The number of TV audiences drops dramatically from 8 p.m. till it reaches its bottom at 3 p.m. On the other hand, there is a sharp increase in radio audience from 6 a.m. to 9 a.m., peaking at about 38% at 8 a.m. [Crack IELTS with Rob] However, from this point onwards, it declines gradually for the rest of the day, bottoming out at 4:00 a.m. the next day.
q41-hide
Please click the red words below for other Sections in this Mock Test:
| Mock Test 18 | Speaking Part 2 |
| Mock Test 18 | Speaking Part 1 |
| Mock Test 18 | Writing Task 2 |
