
WRITING TASK 1
You should spend about 20 minutes on this task.
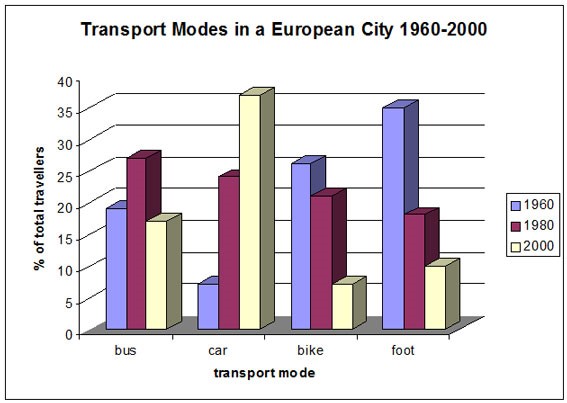
The following bar chart shows the different modes of transport used to travel to and from work in one European city in 1960, 1980 and 2000.
Summarize the information by selecting and reporting the main features, and make comparisons where relevant.
Write at least 150 words.
IELTS WRITING TASK 1 (ACADEMIC TRAINING MODULE)
The bar chart shows the changing patterns of transport use in a European city during the period from 1960 to 2000. [Crack IELTS with Rob] In brief, the chart shows that the use of the car as a means of transport dramatically increased over the period shown, while the others fell.
In detail, in 1960 the motor car was used least as a method of transport with only about 7% of the population using this method but car use grew steadily and strongly to finally reach about 37% of the population by 2000. [Crack IELTS with Rob] This was a massive 5-fold increase in use.
Over this same period, however, the popularity of walking, which had been the most popular means of transport with 35% of the population in 1960 having it as their preferred way of getting around, fell to 10%. [Crack IELTS with Rob] Bicycle use also fell from a high of about 27% in 1960 to just 7% in 2000.
On the other hand, bus use was more erratic being popular with almost 20% of the population in 1960 and rising to a peak of about 27% in 1980 before falling back to about 18% in 2000.


.png)
.png)